← Back to products
AMAI Efficiency

Digital control for the production line

The system counts output, defects and efficiency in real time, logs downtime and its causes, helps call in the right team fast, and gives management a clear picture of losses.

System description

AMAI Efficiency brings together sensors on the line, a screen next to the equipment, an app for the operator or shift lead, alerts for technical teams, and a management dashboard.

The system does more than say whether the line is running well. It explains where efficiency is lost, why stops repeat, who responds, and how long it takes to fix.

OEE and throughput Tracking availability, performance, quality and output on the line
Downtime and stop causes Logging how long stops last and classifying causes for later analysis
Dashboards by role Line screen, operator app, shift lead panel, team alerts and management dashboard

One digital loop

The system links the line, the people and management reports into one chain, so no event gets lost between the shift, the mechanic and the manager.

On the line

  • Sensors at the line's entry and exit
  • Efficiency screen next to the site
  • Logging output, defects and micro-stops
  • Connecting to the PLC, SCADA or equipment signals

For the shift

  • Operator or shift lead app
  • Picking a downtime cause from a reference list
  • A comment through the "Other" field
  • Calling a mechanic, electrician or picker

For management

  • Production management dashboard
  • Tracking team response time
  • Top recurring causes of loss
  • AI hints for common stops
Real deployment

How the system works on the line

One production site ties together equipment, local data processing and the shift screen. What follows is not a mockup, it is pieces of an installed system.
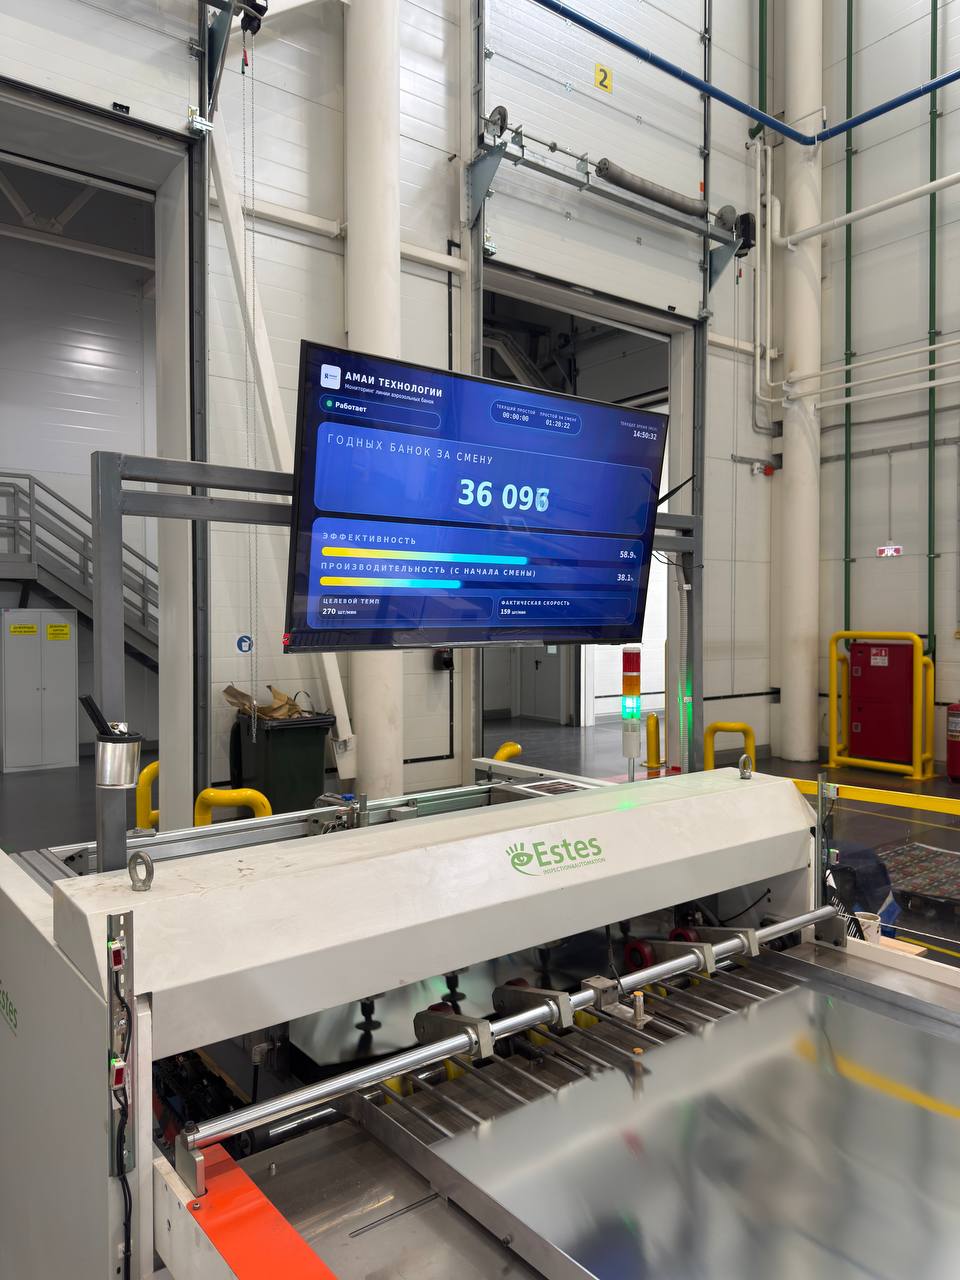
AMAI Efficiency screen next to the production line
Live siteStaff see the metrics right next to the equipment
3 stages

From an equipment signal to a shift decision

Sensors track product movement and line state. A local module collects events, and the screen shows output, pace and downtime without any manual data entry.
  1. 01 · Collectsensor and equipment signals
  2. 02 · Processevents inside the plant's own network
  3. 03 · Showclear metrics for the operator and the manager
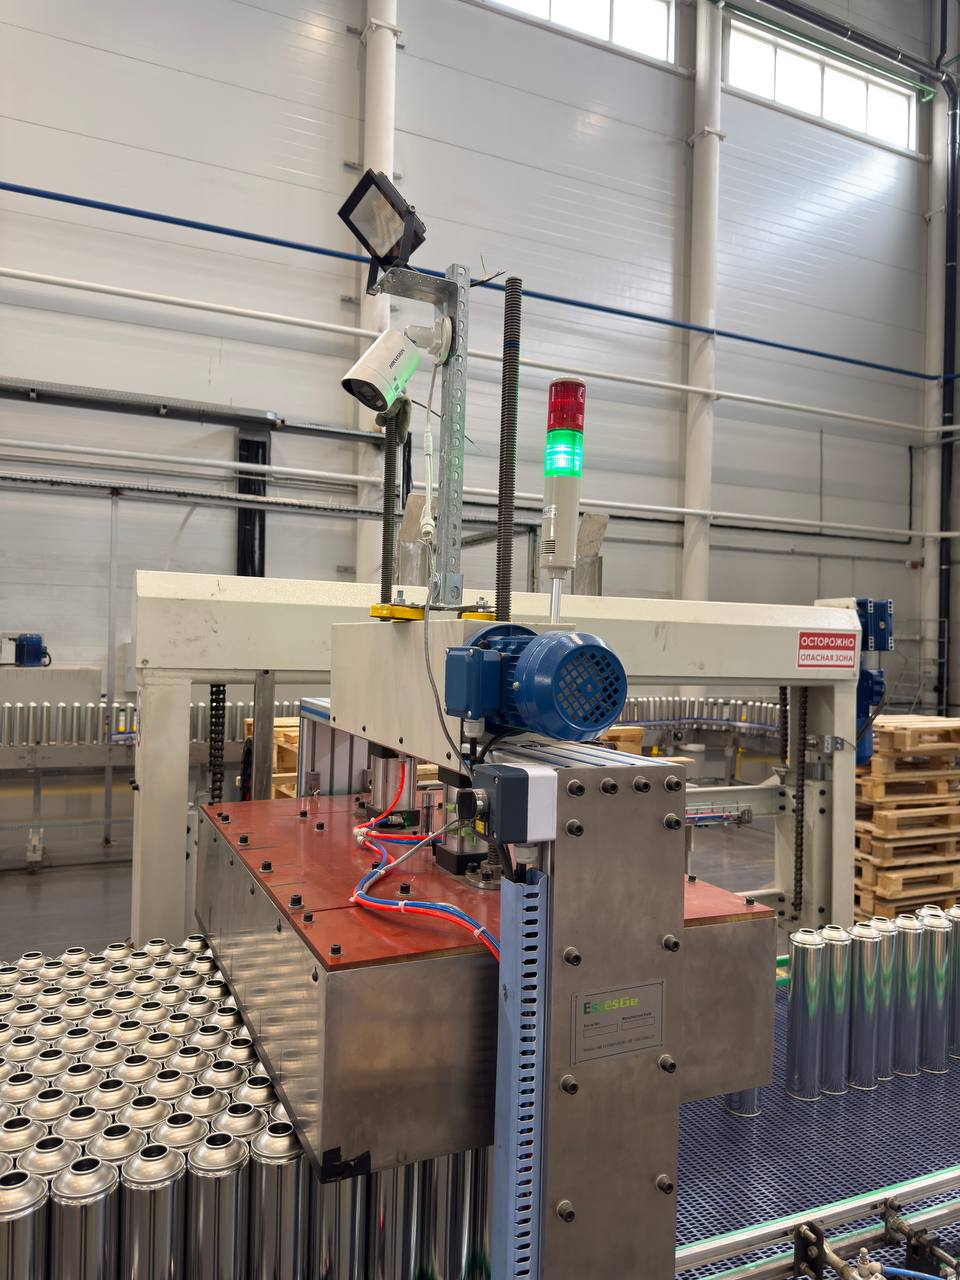
Camera at the inspection point
Camerasite monitoring
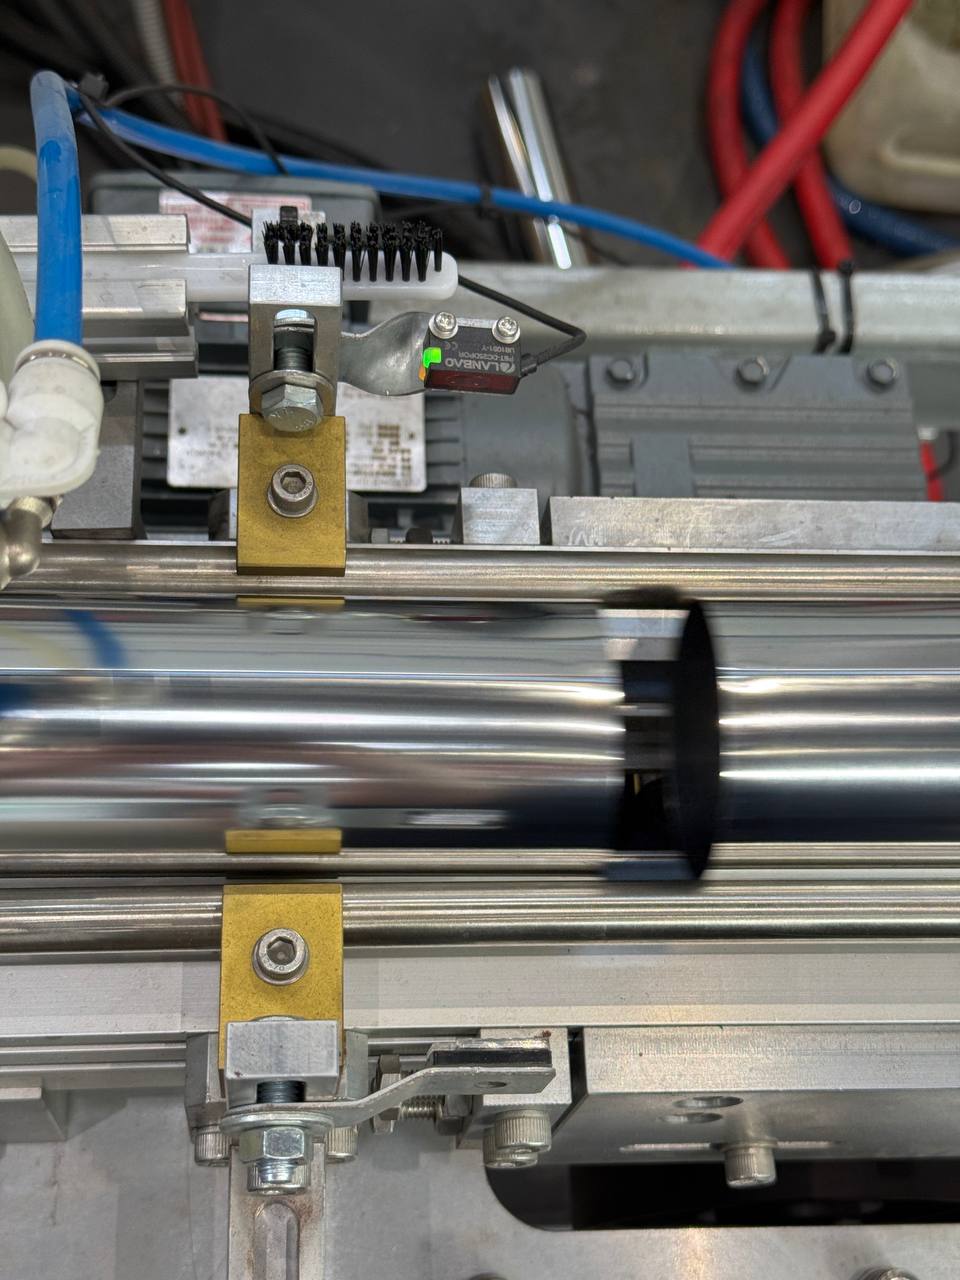
Product pass-through sensor
Sensorpass logged
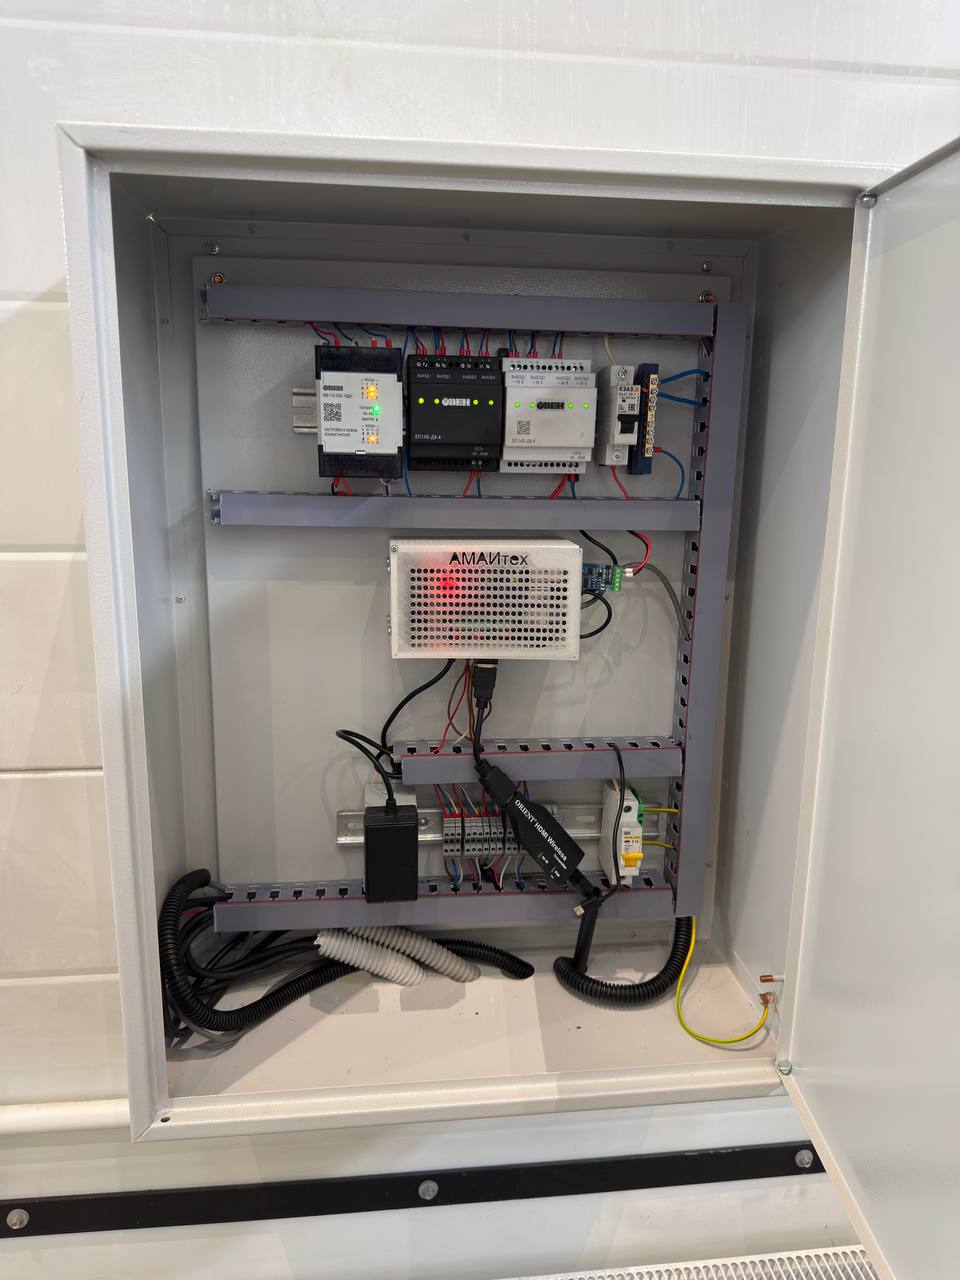
AMAItech data collection cabinet
Edge moduledata collection and transfer
Video from the floorsystem in a live environment
The economics of loss

How much a plant loses to micro-stops

Enter your line's parameters. The calculator estimates how much time and money short stops quietly cost you over a year.

In this estimate:250 working days8 hours per shiftOEE target of 85%
Potential hidden losses $101K/yr

The direct cost of the time a line loses to repeated short stops.

Time lost1,000 h/yr
Micro-stops40 min/shift
Current OEE72%
Headroom up to 85%+13 pts
Current OEE72%
3 lines x 2 shifts x 250 days x 8 stops x 5 min
Discuss cutting losses This is a preliminary estimate. The exact effect is confirmed after a site survey and a check against actual data.

How a stop gets resolved

1

Signal

The line has stopped, or efficiency has dropped below a threshold

2

Cause

The operator picks a standard cause or adds a comment

3

Call

The shift lead calls the right team through the interface

4

Response

The system logs who took the task and when they arrived

5

Solution

The task closes once the problem is fixed

6

Report

Data feeds the shift report and cause analytics

Rollout steps

1

Site survey

We study the line, equipment, sensor points, staff roles and current reports

2

Basic connection

We install sensors or connect to the PLC, then set up data collection and the efficiency screen

3

Downtime causes

We set up the operator app, the reference list of causes, and event alerts

4

Calling in a team

We add mechanic, electrician and picker roles, task status and response tracking

5

Dashboards and reports

We build shift, daily and weekly reports by loss, line and team

6

AI assistant

Once there is enough history, we add hints for common stop causes

What the system does

The system turns scattered events on the line into one digital picture of production.

Metrics

  • OEE and throughput
  • Inbound and outbound flow
  • Defects, losses and micro-stops
  • Stop causes

Interfaces

  • A screen or TV on the line
  • Operator app for logging downtime
  • Alerts for teams
  • Management dashboard

Reports

  • Shift report on output and losses
  • Daily top downtime causes
  • Weekly efficiency trend
  • Report on mechanic and electrician work

Leave a request

We will get in touch and shape a solution for your production task.